Managed Futures Charts
CHARTS!
They say a picture is worth a thousand words. Therefore, we hope these Managed Futures charts save you thousands and more! We speak figuratively, of course, but on this page is a series of hand-picked, helpful and informative Managed Futures charts. There is a sea of data available about Managed Futures investments. These Managed Futures charts help you navigate that data and gain an understanding of how Managed Futures investments compare to traditional asset classes. There is risk in all investing, but not all risk is the same. We’re a strong proponent of portfolio diversification and these charts illustrate why.

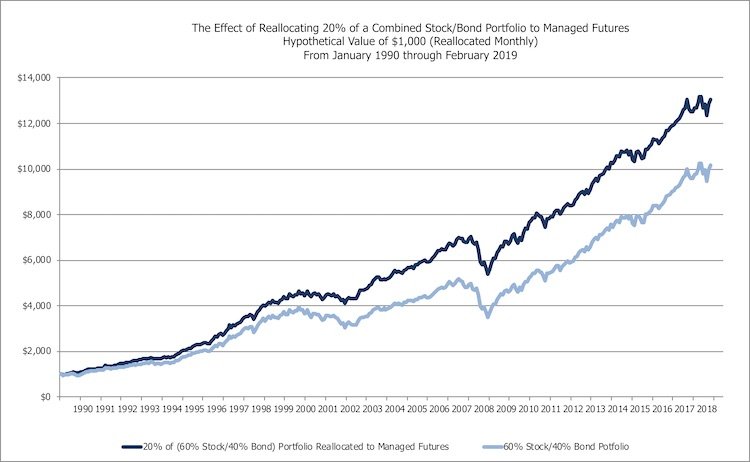
Effect of Reallocating to Managed Futures

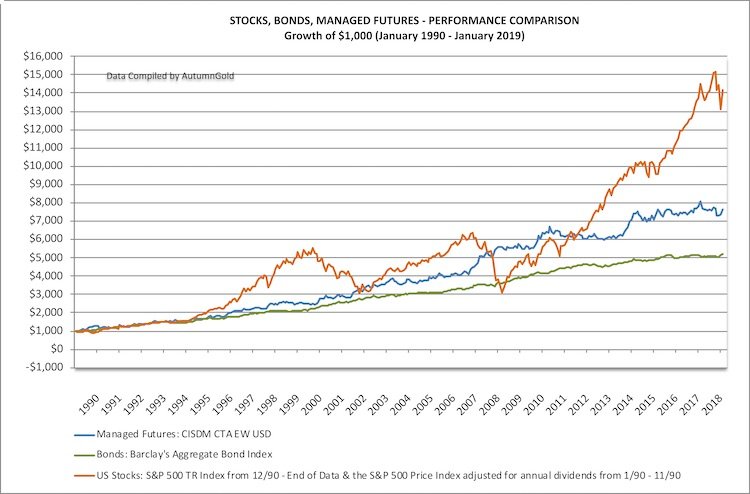
Managed Futures vs. Stocks & Bonds

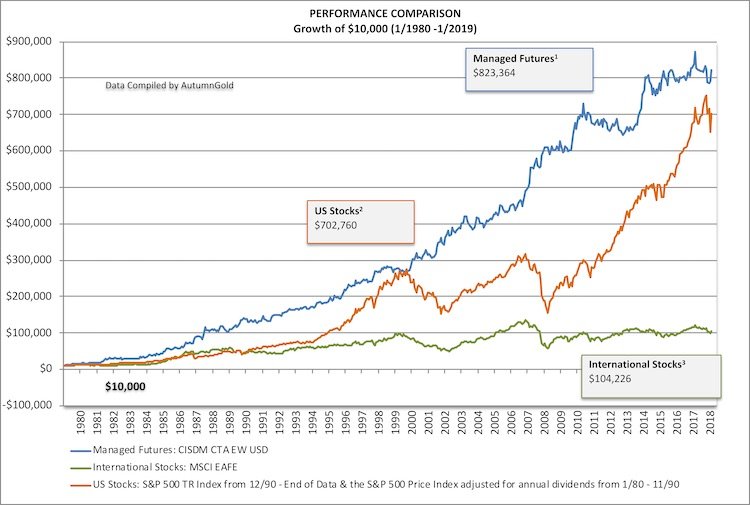
Managed Futures vs. U.S. & International Stocks

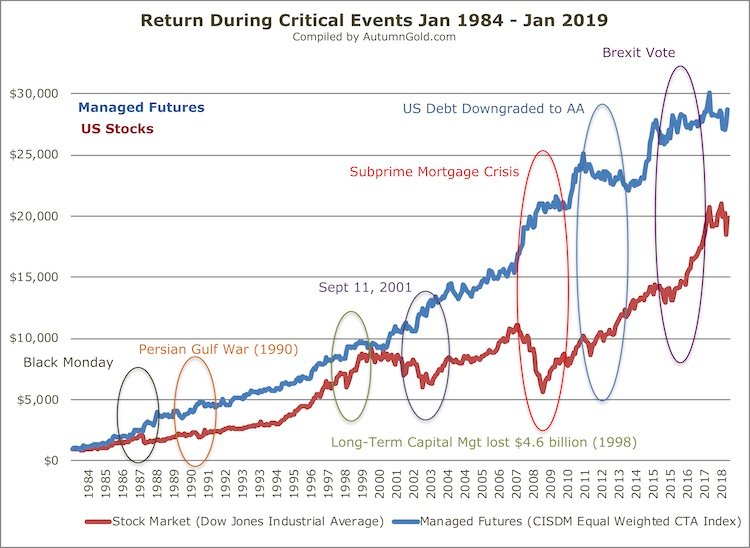
Managed Futures Return During Critical Events
The addition of Managed Futures to a client’s portfolio does not mean that a portfolio will be profitable. It also does not mean the portfolio will not experience substantial losses and that the studies conducted in the past may not be indicative of current time periods or of the performance of any individual CTA.
Additionally, Managed Futures charts construct data by reallocating on a monthly basis.
Stocks
Stocks are represented by the S&P 500 Total Return Index from December 1990 to the end of Data and by the S&P 500 Price Index adjusted for dividends from January 1990 through November 1990. The S&P 500 indices are designed to reflect all sectors of the U.S. equity markets. The S&P 500 includes 500 blue chip, large-cap stocks, which together represent about 75% of the total U.S. equities market. Companies eligible for addition to the S&P 500 have market capitalization of at least US$3.5 billion. Also, the Total Return Index accounts for the reinvestment of dividends.
Bonds
Barclay’s US Aggregate Bond Index (formerly known as the Lehman US Aggregate Bond Index) represent bonds. The U.S. Aggregate Bond Index is a broad-based benchmark that measures the investment grade, U.S. dollar-denominated, fixed-rate taxable bond market, including Treasuries, government-related and corporate securities, MBS (agency fixed-rate and hybrid ARM pass-throughs), ABS, and CMBS. The U.S. Aggregate rolls up into other Barclays Capital flagship indices such as the multi-currency Global Aggregate Index and the U.S. Universal Index, which includes high yield and emerging markets debt. The U.S. Aggregate Index developed in 1986, with index history backfilled to January 1, 1976.
Autumn Gold CTA Index
The Autumn Gold CTA Index represents Managed Futures. In other words, the Autumn Gold CTA Index includes the client performance of all CTA programs noted in the Autumn Gold database and does not represent the complete universe of CTAs. Autumn Gold excludes CTA programs with proprietary performance. Monthly numbers update 45 days after the end of the month.
RISK DISCLOSURE
Past Performance is not necessarily indicative of future results. The risk of trading commodity futures, options, and foreign exchange (“Forex”) is substantial. The high degree of leverage associated with commodity futures, options, and forex can work against you as well as for you. This high degree of leverage can result in substantial losses, as well as gains. You should carefully consider whether commodity futures, options, and forex is suitable for you in light of your financial condition. If you are unsure you should seek professional advice. Past performance does not guarantee future success. In some cases, managed accounts are charged substantial commissions and advisory fees. Those accounts subject to these charges may need to make substantial trading profits just to avoid depletion of their assets. Each commodity trading advisor (“CTA”) is required by the commodity futures trading commission (“CFTC”) to issue to prospective clients a risk disclosure document outlining these fees, conflicts of interest and other associated risks. A hard copy of these risk disclosure documents is readily available by clicking on each CTA’s “request disclosure document” button. The full risk of commodity futures, options, and forex trading cannot be addressed in the risk disclosure statement. No consideration to investing should be made without thoroughly reading the disclosure document of each of the CTAs in which you may have an interest. Requesting a disclosure document places you under no obligation and each document is provided at no cost. The CFTC has not passed upon the merits of participating in any of the following programs nor on the adequacy or accuracy of the disclosure documents. Other disclosure statements are required to be provided to you before an account may be opened for you.
Prospective clients should not base their decision on investing in this trading program solely on the past performance presented. Additionally, in making an investment decision, prospective clients must also rely on their own examination of the person or entity making the trading decisions and the terms of the advisory agreement including the merits and risks involved.
Limitations of rankings are that only those advisors or pool operators that submitted their performance data to AutumnGold were rated. The entire CTA universe is not included in the rankings. The performance information provided wherein has not been verified by AutumnGold. The past performance is not necessarily indicative of future results.
AutumnGold CTA indexes are non-investable indexes comprised of the client performance of CTA programs included in the AutumnGold database and do not represent the complete universe of the CTAs. investors should note that it is not possible to invest in these indexes.

